极速体验 Prometheus 是什么,以及可以干什么~
初体验
运行 Prometheus
会 Linux 的同学一般看了需要在 Windows 上进行怎么操作就知道怎么在 Linux 上操作了,
反过来则不行,所以既然是极速体验,那么就将怎么在 Windows 运行好了~
首先到 Prometheus 官方- Download 下载最新版本,
下载后,解压,得到:
prometheus.exe—— 主要负责数据采集和存储,提供 PromQL 查询语言的支持。prometheus.yml—— 配置promtool.exe—— 命令行工具
用 promtool.exe 检查 prometheus.yml 文件是否 OK
1 | prometheus>promtool check config prometheus.yml |
prometheus.yml 中已经有简单的配置,抓数据的时间间隔以及一个被抓取目标(Prometheus 它自身的运行情况)~
所以我们双击 prometheus.exe 运行起来,然后浏览 localhost:9090 则能看到 UI 界面了~
Prometheus 会抓取自身运行时的 metrics(指标),你可以浏览 localhost:9090/metrics 看看抓取的内容
回到 localhost:9090/graph 在 -insert metric at sursor- 下拉框中选择 go_goroutines
然后点击 Execute 按钮,那么在 Console 选项卡中可以看到当前有多少个 Go协程:
| Element | Value |
|---|---|
| go_goroutines{instance=”localhost:9090”,job=”prometheus”} | 41 |
点击 Graph 选项卡,可以看到 Go协程 数量的变化情况~
新增一个被抓取的目标(应用运行时)
由于 Prometheus 自身是 Go 语言编写的,所以我们来创建一个 DotNet 的客户端让 Prometheus 抓取,来区分 metrics 的区别
新增一个空的 Web 项目,用 NuGet 添加 prometheus-net.AspNetCore,在 Startup.cs 添加两行代码:1
2
3
4
5
6
7
8
9
10
11
12
13
14
15
16
17
18
19
20
21
22
23
24
25
26
27
28
29
30
31
32
33
34
35
36
37
38
39
40
41
42
43
44
45using System;
using System.Collections.Generic;
using System.Linq;
using System.Threading.Tasks;
using Microsoft.AspNetCore.Builder;
using Microsoft.AspNetCore.Hosting;
using Microsoft.AspNetCore.Http;
using Microsoft.Extensions.DependencyInjection;
using Microsoft.Extensions.Hosting;
using Prometheus;// !!
namespace MyWebApp
{
public class Startup
{
public void ConfigureServices(IServiceCollection services)
{
}
public void Configure(IApplicationBuilder app, IWebHostEnvironment env)
{
if (env.IsDevelopment())
{
app.UseDeveloperExceptionPage();
}
app.UseRouting();
//app.UseHttpMetrics(); // 加上这句可以提供更多被抓取的信息
app.UseEndpoints(endpoints =>
{
// !!
endpoints.MapMetrics();
endpoints.MapGet("/", async context =>
{
await context.Response.WriteAsync("Hello World!");
});
});
}
}
}
运行起来,Visual Studio 给我分配的端口是 http://localhost:4763,
浏览 http://localhost:4763/metrics 则能看到 Prometheus 时提供的数据~
编辑 prometheus.yml,在 scrape_configs 处新增一个要被抓取的目标:
1 | scrape_configs: |
重启 prometheus.exe
在 localhost:9090 界面中,点击 Status 选择 Targets 或者 Service Discovery 看看
另外,在 localhost:9090/graph 在 -insert metric at sursor- 下拉框中也会出现 dotnet_... 的选项了~
下面的表格现实 MyWebApp 某时刻使用了多少线程:
| Element | Value |
| ————————————————————— | —– |
| process_num_threads{instance=”localhost:4763”,job=”app-my-web”} | 46 |
新增一个被抓取的目标(服务器运行时)
从上面的抓取数据可以看出,
我们的 DotNet 应用只提供了 DotNet 运行时的信息,
我们的 Go 应用也只提供 Go 运行时的信息,
它们都没有服务器的 CPU、内存、磁盘、I/O 等信息~
那是如果一台机器上部署多个应用,都提交服务器信息,有点重复了,
因此我们需要一个专门的来做这个事情,
node_exporter —— 作用是收集服务器系统数据~
依旧到官方下载页面 https://prometheus.io/download
查看页面 node_exporter 处,你会发现,既然没有提供 Windows 版本的 (╯‵□′)╯︵┻━┻
_猜猜其它 xxxx_exporter 的作用~_
所以我们现在需要一台 Linux,在 Linux 上运行 node_exporter
怎么下载,运行什么的就不说了~
怎么的时候,可以看到 address=:9100
浏览 http://192.168.86.99:9100/metrics 可以看到提供要被抓的数据,192.168.86.99 是我的 IP 地址,请替换~
编辑 prometheus.yml,在 scrape_configs 处新增一个要被抓取的目标:
1 | scrape_configs: |
重启 prometheus.exe
在 localhost:9090 界面中,点击 Status 选择 Targets 或者 Service Discovery 看看
另外,在 localhost:9090/graph 在 -insert metric at sursor- 下拉框中也会出现 node_... 的选项了~
下面的表格现实服务器某时刻使用了多少内存:
| Element | Value |
| —————————————————————————- | —— |
| node_memory_Active_bytes{instance=”192.168.86.99:9100”,job=”node-ubuntu-99”} | xxxxxx |
初体验小结
初体验的感觉就是各种 low,界面 low,而且既然还要手动修改配置,
作为容器专门为容器时代设计的 Prometheus 很明显,不应该是这样子的~
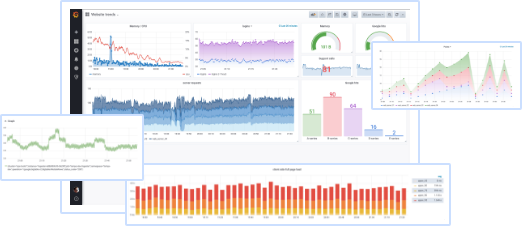
Grafana
Prometheus 的 UI 界面很 low,如果是下面这样的界面,瞬间就高大上了,有没有~
所以赶紧到 Grafana 官方下载页面:https://grafana.com/grafana/download
先试试 Windows 版本的,有 安装版本 和 解压版本
安装版本,安装后,会有一个 Grafana 服务运行着
所以这里选择解压版本的,点击 Download the zip file
下载解压后,运行 grafana\bin\grafana-server.exe
输入 admin admin
登录成功会提示你修改密码,点 Skip 跳过~
添加数据源


选择 Prometheus
在 URL 处填上 http://localhost:9090
点击 Save & Test 按钮则会提示 ✔ Data source is working
添加 Prometheus Dashboard
点击,我们创建出来的 Prometheus 数据源,
点击 Dashboards,点击 Prometheus 2.0 Stats 后面的 Import 按钮
然后再点击 Prometheus 2.0 Stats 就可以看到高大上的画面了~
然后这个 Dashboard 是查看 Prometheus 自身的,
我们的应用和服务器,需要添加相应其它 Dashboard
Node Exporter for Prometheus Dashboard
点击 Grafana UI 界面左边菜单的 + ,然后点击 Import
在 Grafana.com dashboard url or id 的文本框中输入:https://grafana.com/grafana/dashboards/8919
或者8919
可以将 Name 的文本框中修改成一个好记的名字~
Select a Prometheus data source 选择 Prometheus
最后点击 Import,也同样可以看到高大上的画面了~
Next
Prometheus 是一个 监控警报系统,我们现在只初体验了监控部分,警报怎么运作呢?
参考资料
https://prometheus.io/docs/introduction/overview
https://github.com/prometheus/client_golang